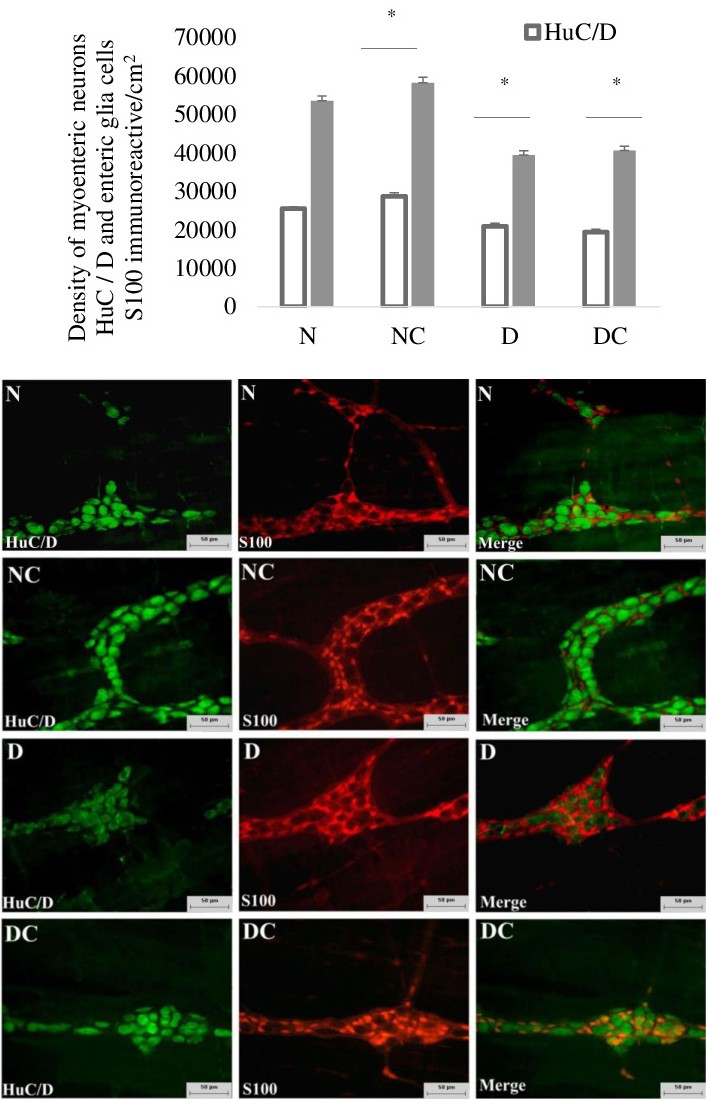
Fig. 1. (Top) Density per unit area (cm2) of HuC/D-immunoreactive myenteric neurons and S-100-immunoreactive enteric glial cells. The results are expressed as mean ± SEM. *p<0.05, compared with N group. (Bottom) Photomicrographs of HuC/D-immunoreactive myenteric neurons and S-100-immunoreactive enteric glial cells in the jejunum in the N, NC, D, and DC groups. Scale bar = 50 μm. n = 6 rats/group.